Lead-lag effect in commodities and Bitcoin
Introduction
It has been more than a month since I started working as a data scientist at a commodity trading company. As part of my job, I develop systematic trading strategies for commodities, particularly for metals markets. I try different popular strategies and ideas, such as trend, momentum, mean reversion, and carry. I will describe my experience because I love writing and I think we can all learn from this. I’ll test some known investment strategies and share my findings without going into any detail of my job.
The topic of the first article will be the lead-lag effect in metals markets. What is the lead and lag effect? There are many assets which are correlated with each other, like gold and silver, Brent and WTI, KO (Coca-Cola) and PEP (Pepsi) shares etc. Moves in one such security can and commonly does have an effect on another, similar security. If you plot two correlated assets, you see that their prices tend to track each other. However, this doesn’t typically happen instantly and there can be a lag after which the effect of one asset on another one can be seen. This is what we mean by “lead-lag effect”. Lead-lag analysis is used to test whether a leading variable is cross-correlated with the lagging variable.
Lead-lag analysis example
China is the world’s largest producer of steel and one of the largest producers and exporters of rebar. Given its role in steel industry, I’d expect that China has a huge impact on global steel prices. There are various steel products out of which I select rebar for this analysis. The main reason is that they are traded at both a Chinese and European exchange with relatively good liquidity. We hypothesize that a change in Chinese rebar prices lead to a change in rebar prices in other regions, and it takes some time for this effect to happen.
Hypothesis: Rebar prices traded at London Metal Exchange (LME) track those at Shanghai Futures Exchange (SHFE) with a lag.
Getting the data
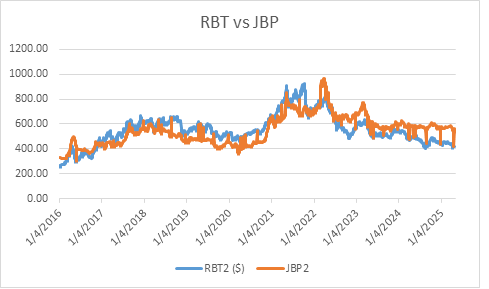
First, we download price data of both commodities – RBT (Rebar traded at SHFE) and JBP (rebar traded at LME). Note that RBT price is priced in yuan. To make it apple-to-apple, we convert it USD. Let’s first visualize prices of both commodities.
It’s clear that these two assets tracked each other pretty closely over the observation period, from 2016 January to 2025 May.
As a next step, we can analyze cross-correlation of SHFE and LME rebar futures over several lags.
The result is not promising. Correlation without any lag is modest 0.08 and changes around 0 for different lags. This implies that changes in SHFE rebar prices don’t significantly influence those in LME rebar prices. Surprisingly, rebar prices in two different parts of the world, Asia and Europe, are not highly correlated.
Then I ran a Granger causality test to statistically test if SHFE returns help predict LME returns. All lags from 1 to 10 are statistically significant from which we can conclude that SHFE rebar prices Granger-cause LME rebar prices. Another way to put it is as follows. Lagged (past) values of SHFE contain predictive information about today’s LME price.
Keep reading with a 7-day free trial
Subscribe to Actionable Trading Strategies to keep reading this post and get 7 days of free access to the full post archives.


